Re: [PATCH 2/6] thermal: of: Export non-devres helper to register/unregister thermal zone
From: Claudiu Beznea <claudiu.beznea@tuxon.dev>
Date: 2025-02-03 16:30:37
Also in:
linux-clk, linux-devicetree, linux-pm, linux-renesas-soc, lkml
Hi, Daniel,

On 31.01.2025 01:16, Claudiu Beznea wrote:
quoted hunk ↗ jump to hunk
Hi, Daniel,

On 31.01.2025 00:33, Daniel Lezcano wrote:
quoted
On 30/01/2025 21:53, Claudiu Beznea wrote:quoted
Hi, Daniel,

On 30.01.2025 19:24, Daniel Lezcano wrote:
quoted
On 30/01/2025 11:30, Claudiu Beznea wrote:quoted
On 30.01.2025 12:07, Daniel Lezcano wrote:quoted
On Thu, Jan 30, 2025 at 11:08:03AM +0200, Claudiu Beznea wrote:quoted
Hi, Daniel,[ ... ]quoted
quoted
quoted
quoted
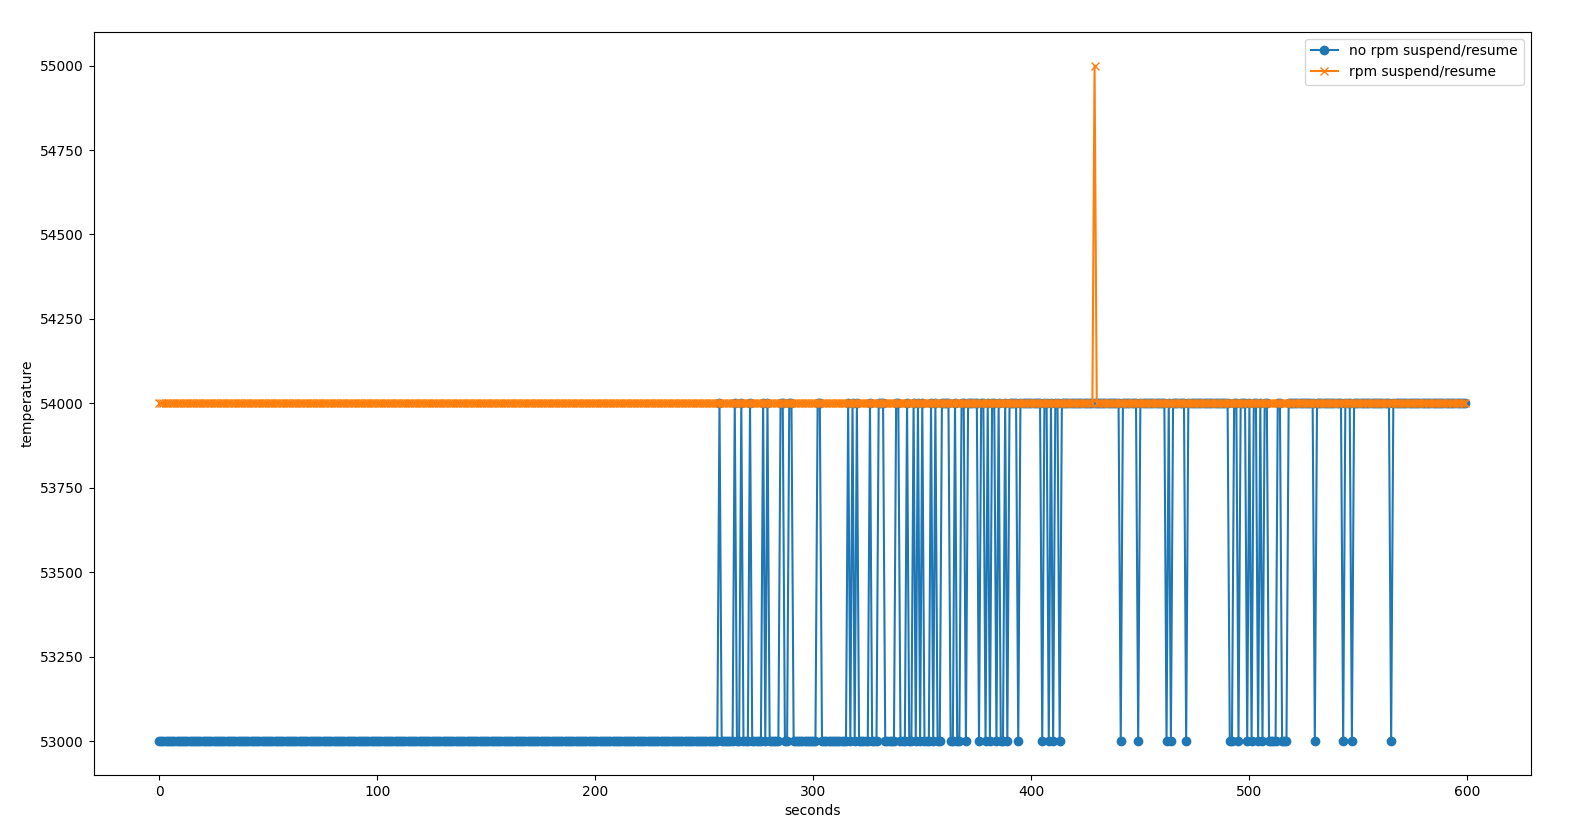
Would the IP need some cycles to capture the temperature accurately
after the
clock is enabled ?
There is nothing about this mentioned about this in the HW manual of the RZ/G3S SoC. The only points mentioned are as described in the driver code: - wait at least 3us after each IIO channel read - wait at least 30us after enabling the sensor - wait at least 50us after setting OE bit in TSU_SM For this I chose to have it implemented as proposed.IMO, disabling/enabling the clock between two reads through the pm runtime may not be a good thing, especially if the system enters a thermal situation where it has to mitigate. Without any testing capturing the temperatures and compare between the always-on and on/off, it is hard to say if it is true or not. Up to you to test that or not. If you think it is fine, then let's go with it.I tested it with and w/o the runtime PM and on/off support (so, everything ON from the probe) and the reported temperature values were similar.Did you remove the roundup to 0.5°C ?I did the testing as suggested and, this time, collected results and compared side by side. I read the temperature for 10 minutes, 60 seconds after the Linux prompt showed up. There is, indeed, a slight difference b/w the 2 cases. When the runtime PM doesn't touch the clocks on read the reported temperature varies b/w 53-54 degrees while when the runtime PM enables/disables the clocks a single read reported 55 degrees, the rest reported 54 degrees. I plotted the results side by side here: https://i2.paste.pics/f07eaeddc2ccc3c6695fe5056b52f4a2.png? trs=0a0eaab99bb59ebcb10051eb298f437c7cd50c16437a87392aebc16cd9013e18&rand=vWXm2VTrbt Please let me know how do you consider it.After sending this to you I figured it out that precision is lost somewhere so I re-tested it with the following diff (multiplied parts of the equation with 1000):diff --git a/drivers/thermal/renesas/rzg3s_thermal.cb/drivers/thermal/renesas/rzg3s_thermal.c index 6719f9ca05eb..84e18ff69d7c 100644--- a/drivers/thermal/renesas/rzg3s_thermal.c +++ b/drivers/thermal/renesas/rzg3s_thermal.c@@ -83,7 +83,7 @@ static int rzg3s_thermal_get_temp(structthermal_zone_device *tz, int *temp) } ret = 0; - ts_code_ave = DIV_ROUND_CLOSEST(ts_code_ave, TSU_READ_STEPS); + ts_code_ave = DIV_ROUND_CLOSEST(MCELSIUS(ts_code_ave), TSU_READ_STEPS); /* * According to the HW manual (section 40.4.4 Procedure for Measuring the Temperature)@@ -91,11 +91,8 @@ static int rzg3s_thermal_get_temp(structthermal_zone_device *tz, int *temp) * * Tj = (ts_code_ave - priv->calib0) * 165 / (priv->calib0 - priv->calib1) - 40 */ - *temp = DIV_ROUND_CLOSEST((ts_code_ave - priv->calib1) * 165, - (priv->calib0 - priv->calib1)) - 40; - - /* Report it in mili degrees Celsius and round it up to 0.5 degrees Celsius. */ - *temp = roundup(MCELSIUS(*temp), 500); + *temp = DIV_ROUND_CLOSEST((u64)(ts_code_ave - MCELSIUS(priv->calib1)) * MCELSIUS(165), + MCELSIUS(priv->calib0 - priv->calib1)) - MCELSIUS(40); rpm_put: pm_runtime_mark_last_busy(dev); With this, the results seems similar b/w runtime PM and no runtime PM cases. The tests were executed after the board was off for few hours. The first test was with runtime PM suspend/resume on each read. Then the board was rebooted and re-run the test w/o runtime PM suspend/resume on reads. Figure with results is here: https://i2.paste.pics/5f353a4f04b07b4bead3086624aba23f.png?trs=0a0eaab99bb59ebcb10051eb298f437c7cd50c16437a87392aebc16cd9013e18&rand=5n34QNjWIDquoted
Thanks for taking the time to provide a figure

Testing thermal can be painful because it should be done under certain
conditions.

I guess there was no particular work load on the system when running the
tests.
No load, indeed.quoted
At the first glance, it seems, without the pm runtime, the measurement is
more precise as it catches more thermal changes. But the test does not give
information about the thermal behavior under stress. And one second
sampling is too long to really figure it out.

In the kernel source tree, there is a tool to read the temperature in an
optimized manner, you may want to use it to read the temperature at a
higher rate. It is located in tools/thermal/thermometer

Compiling is a bit fuzzy ATM, so until it is fixed, here are the steps:

(you should install libconfig-dev and libnl-3-dev packages).

cd $LINUX_DIR/tools/thermal/lib
make
LD_LIBRARY_PATH=$LD_LIBRARY_PATH:$LINUX_DIR/tools/thermal/lib

cd $LINUX_DIR/tools
make thermometer


Then change directory:

cd $LINUX_DIR/tools/thermal/thermometer


Run the tool:

./thermometer -o out -c t.conf -l DEBUG -- <my_command>


The content of the configuration file t.conf is:

thermal-zones = (
          {    name = "cpu[0_9].*-thermal";
        polling = 100; }
      )

All the captured data will be in the 'out' directory

For 'my_command', I suggest to use a script containing:

sleep 10; dhrystone -t 1 -r 120; sleep 10

If you need the dhrystone binary, let me know.

The thermal zone device tree configuration should be changed to use a 65°C
passive trip point instead of 100°C (and the kernel setup with the step
wise governor as default).
quoted
quoted
The resulting figure from the temperature should show a flat temperaturefigure during 10 seconds, then the temperature increasing until reaching the temperature threshold of 65°C, the temperature stabilizing around it, then followed by a temperature decreasing when the test finishes. If the temperature does not reach the limit, decrease the trip point temperature or increase the dhrystone duration (the -r 120 option) At this point, you should the test with and without pm runtime but in order to have consistent results, you should wait ~20 minutes between two tests. The shape of the figures will give the immediate information about how the mitigation vs thermal sensor vs cooling device behave. Additionally, you can enable the thermal DEBUGFS option and add the collected information statistics from /sys/kernel/debug/thermal/*** in the results. Hope that helpsThank you for all these details. I'll have a look on it but starting with Monday as I won't have access to setup in the following days.
I re-run the tests with the thermometer application that you indicated.
This is the conf I used:
thermal-zones = (
{ name = "cpu-thermal";
polling = 100; }
)
The used device tree is as follows:
thermal-zones {
cpu_thermal: cpu-thermal {
polling-delay-passive = <250>;
polling-delay = <1000>;
thermal-sensors = <&tsu>;
sustainable-power = <423>;
cooling-maps {
map0 {
trip = <&target>;
cooling-device = <&cpu0 0 2>;
contribution = <1024>;
};
};
trips {
sensor_crit: sensor-crit {
temperature = <125000>;
hysteresis = <1000>;
type = "critical";
};
target: trip-point {
temperature = <56000>;
hysteresis = <1000>;
type = "passive";
};
};
};
};
I executed with:
time ./thermometer -o out -l DEBUG -c t.conf -- ./test.sh
where test.sh is:
sleep 10; time echo 100000000 | dhry; sleep 10
My dhry has no -t or -r option so I passed the number of runs checking that
the test executes for 120 seconds.
I executed first the thermometer application with runtime PM suspend/resume
on temperature read, then wait for ~25 minutes then executed the tests w/o
runtime PM suspend/resume on temperature read.
The output of the thermometer application is as follows:
- runtime PM suspend/resume when reading: https://p.fr33tux.org/5bbb4d
- no runtime PM suspend/resumes when reading: https://p.fr33tux.org/c9a7cf
- full console log while testing: https://p.fr33tux.org/ace3a6
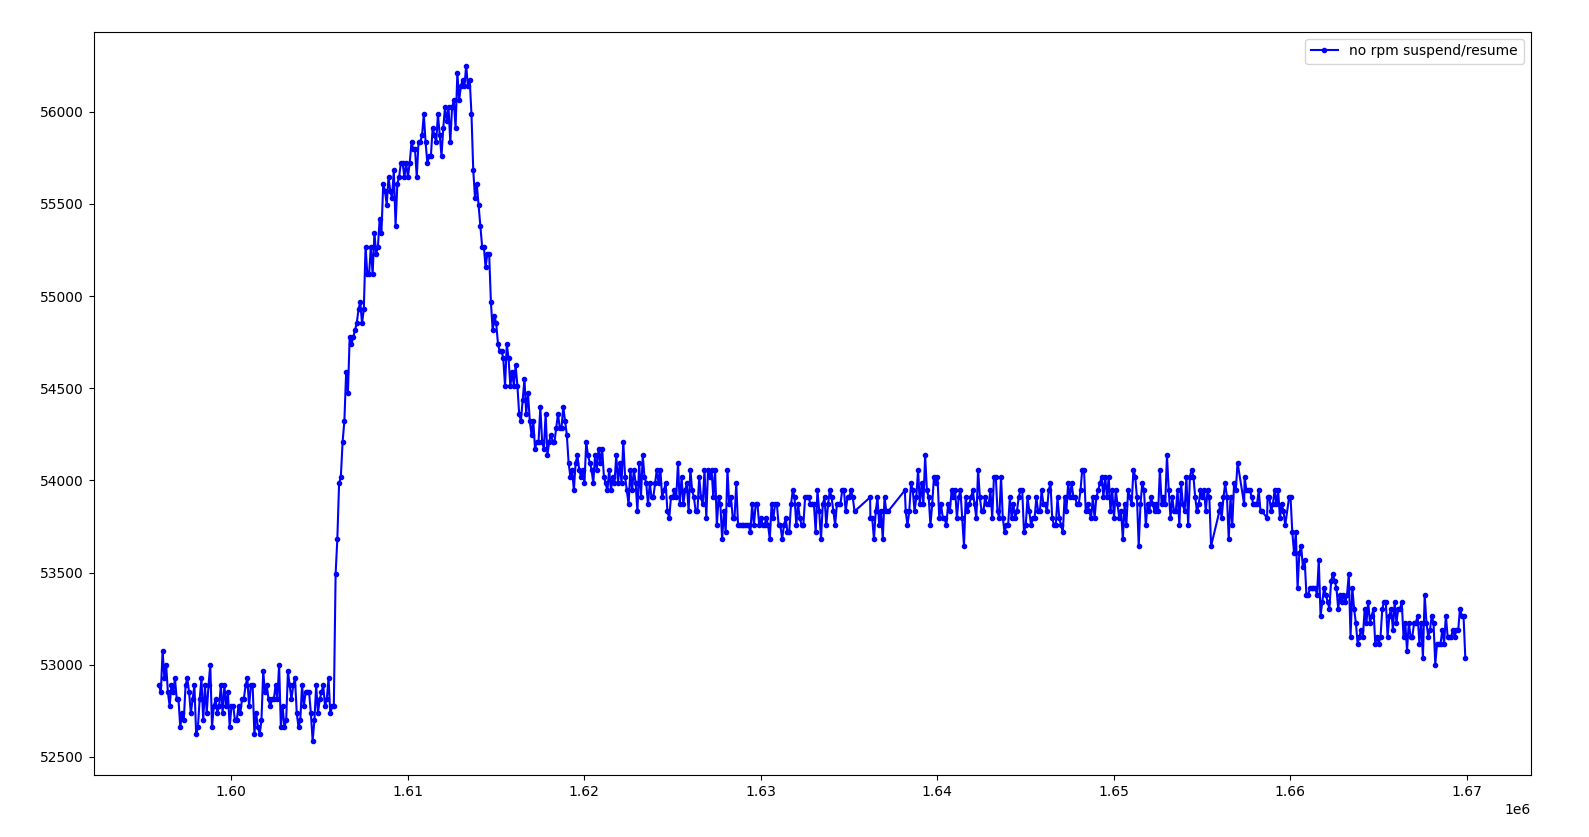
I also plotted the results for visual comparison as follows:
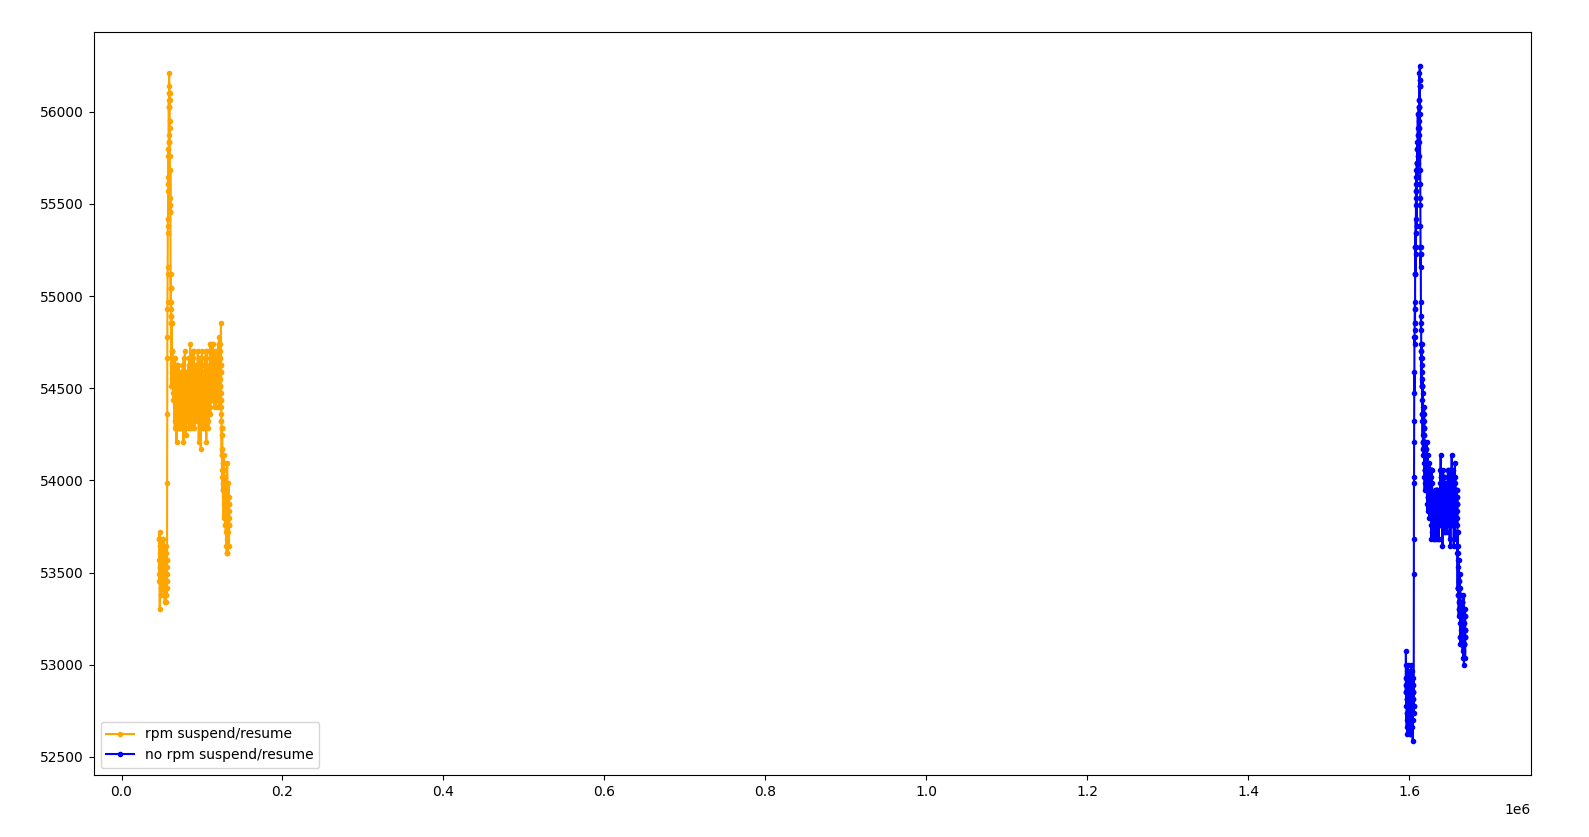
1/ RPM + no-RPM (continuous time base):
https://i2.paste.pics/c3956d15a7a889a9e1ee5b60529b42f6.png?rand=axUi4IsA1C
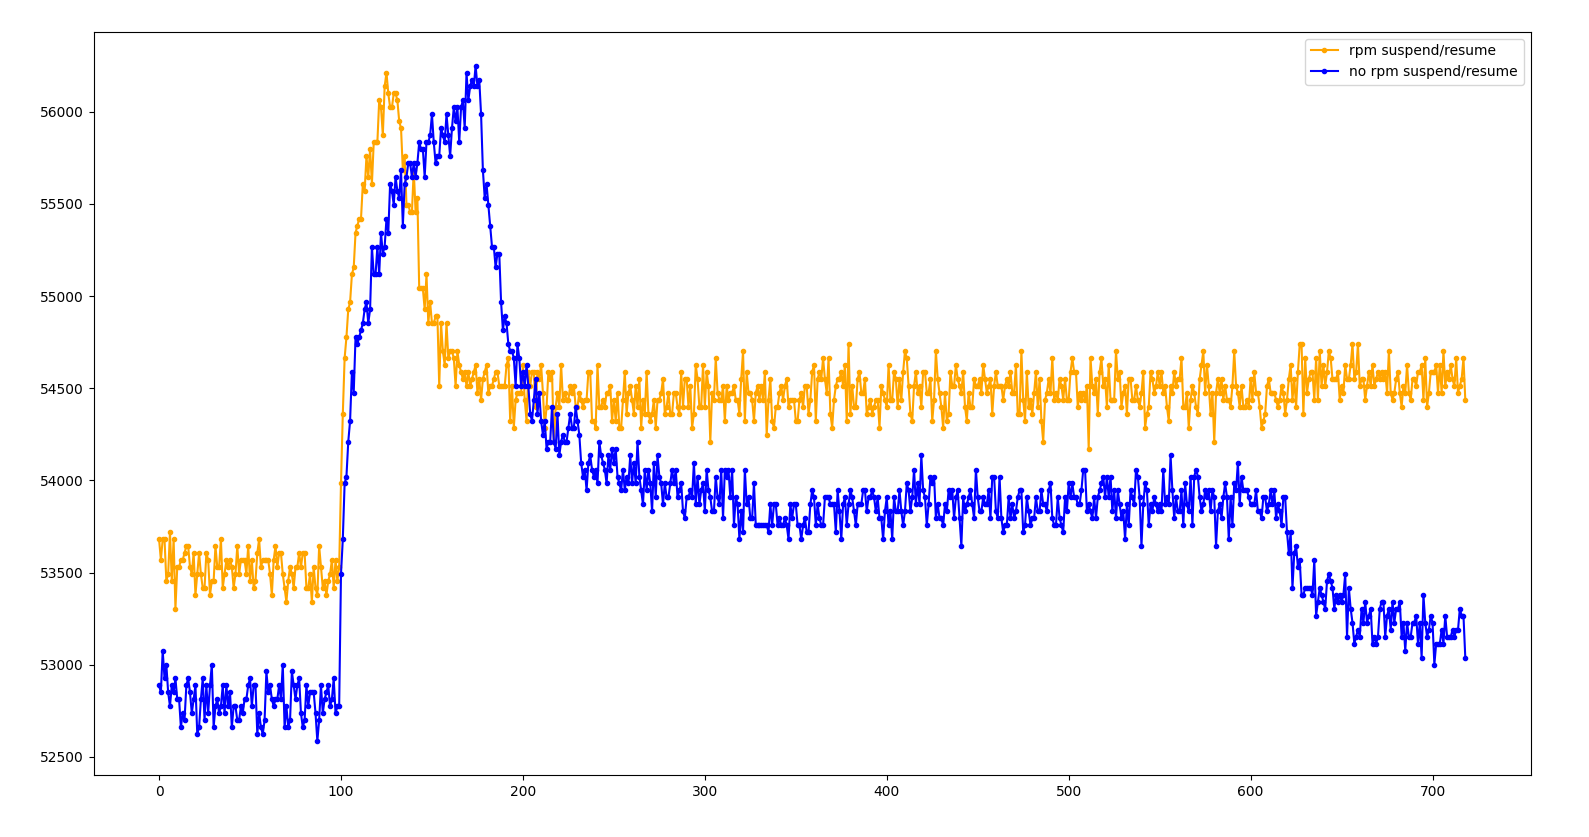
2/ RPM + no-RPM (first samples, for side by side comparison):
https://i2.paste.pics/e2a30af590e28a091415e3afb74eb0ac.png?rand=XQhoxUe1EM
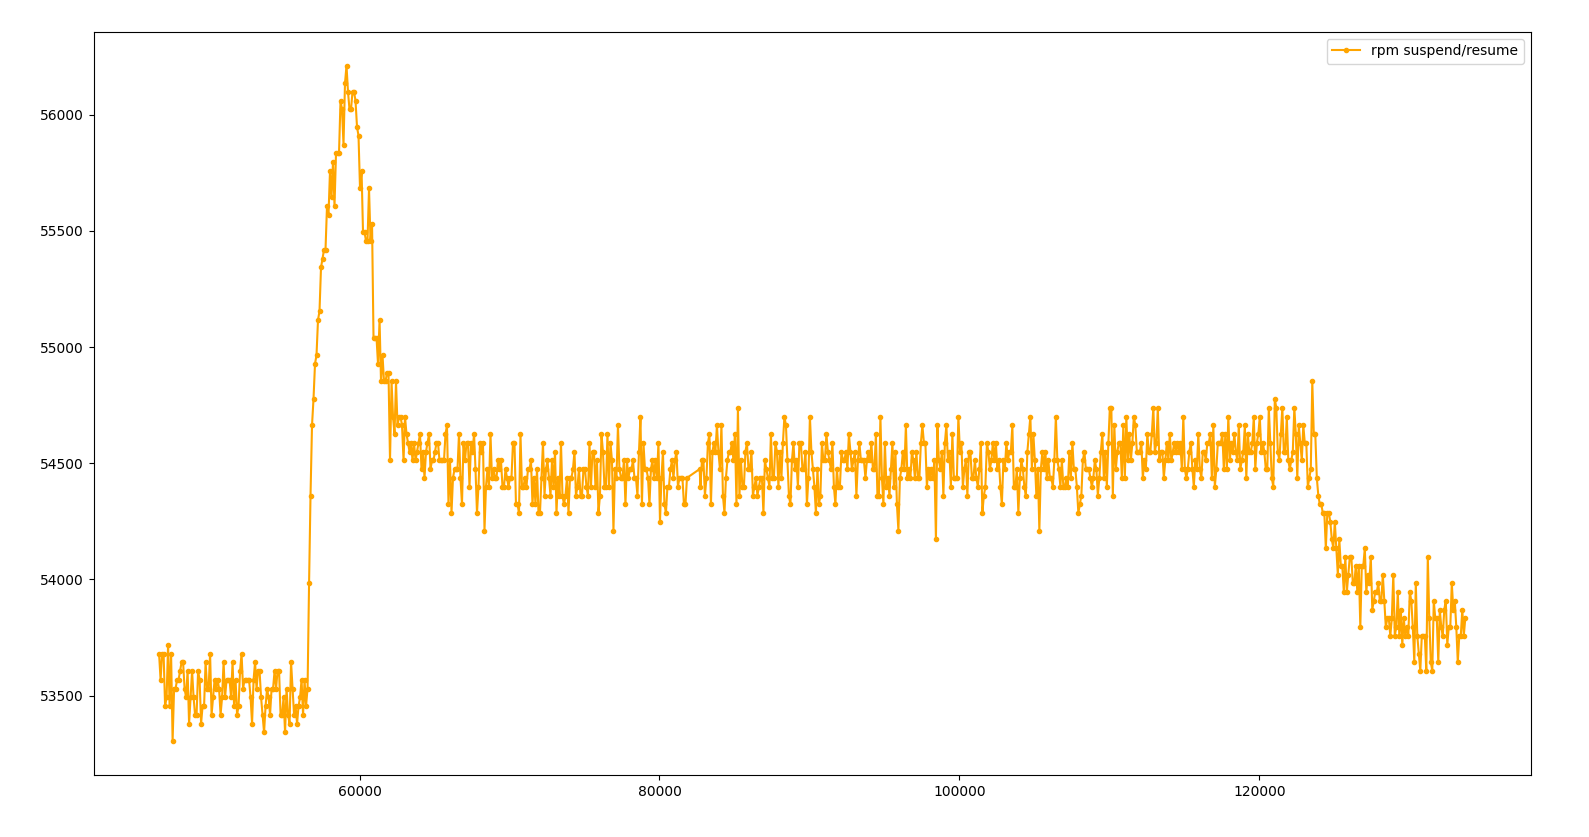
3/ RPM only:
https://i2.paste.pics/977d4de070b8e2a19694ae2b4ba3c5fc.png?rand=IfZOkonRd9
4/ no-RPM only:
https://i2.paste.pics/5d6e3d0a124e5e4b3b8b397d7b5b057c.png?rand=UaigrMRNvy
Please let me know how your input.
Thank you,
Claudiu
Thank you,
Claudiu
quoted