Re: [PATCH v24 00/14] Subject: Introduce Data Access MONitor (DAMON)
flat view
From: SeongJae Park <hidden>
Date: 2021-02-24 14:42:19
Also in:
linux-mm, lkml
On Thu, 4 Feb 2021 16:31:36 +0100 SeongJae Park [off-list ref] wrote:
From: SeongJae Park <redacted>
[...]
Introduction
============

DAMON is a data access monitoring framework for the Linux kernel.  The core
mechanisms of DAMON called 'region based sampling' and 'adaptive regions
adjustment' (refer to 'mechanisms.rst' in the 11th patch of this patchset for
the detail) make it

 - accurate (The monitored information is useful for DRAM level memory
   management. It might not appropriate for Cache-level accuracy, though.),
 - light-weight (The monitoring overhead is low enough to be applied online
   while making no impact on the performance of the target workloads.), and
 - scalable (the upper-bound of the instrumentation overhead is controllable
   regardless of the size of target workloads.).

Using this framework, therefore, several memory management mechanisms such as
reclamation and THP can be optimized to aware real data access patterns.
Experimental access pattern aware memory management optimization works that
incurring high instrumentation overhead will be able to have another try.

Though DAMON is for kernel subsystems, it can be easily exposed to the user
space by writing a DAMON-wrapper kernel subsystem.  Then, user space users who
have some special workloads will be able to write personalized tools or
applications for deeper understanding and specialized optimizations of their
systems.
I realized I didn't introduce a good, intuitive example use case of DAMON for
profiling so far, though DAMON is not for only profiling.  One straightforward
and realistic usage of DAMON as a profiling tool would be recording the
monitoring results with callstack and visualize those by timeline together.

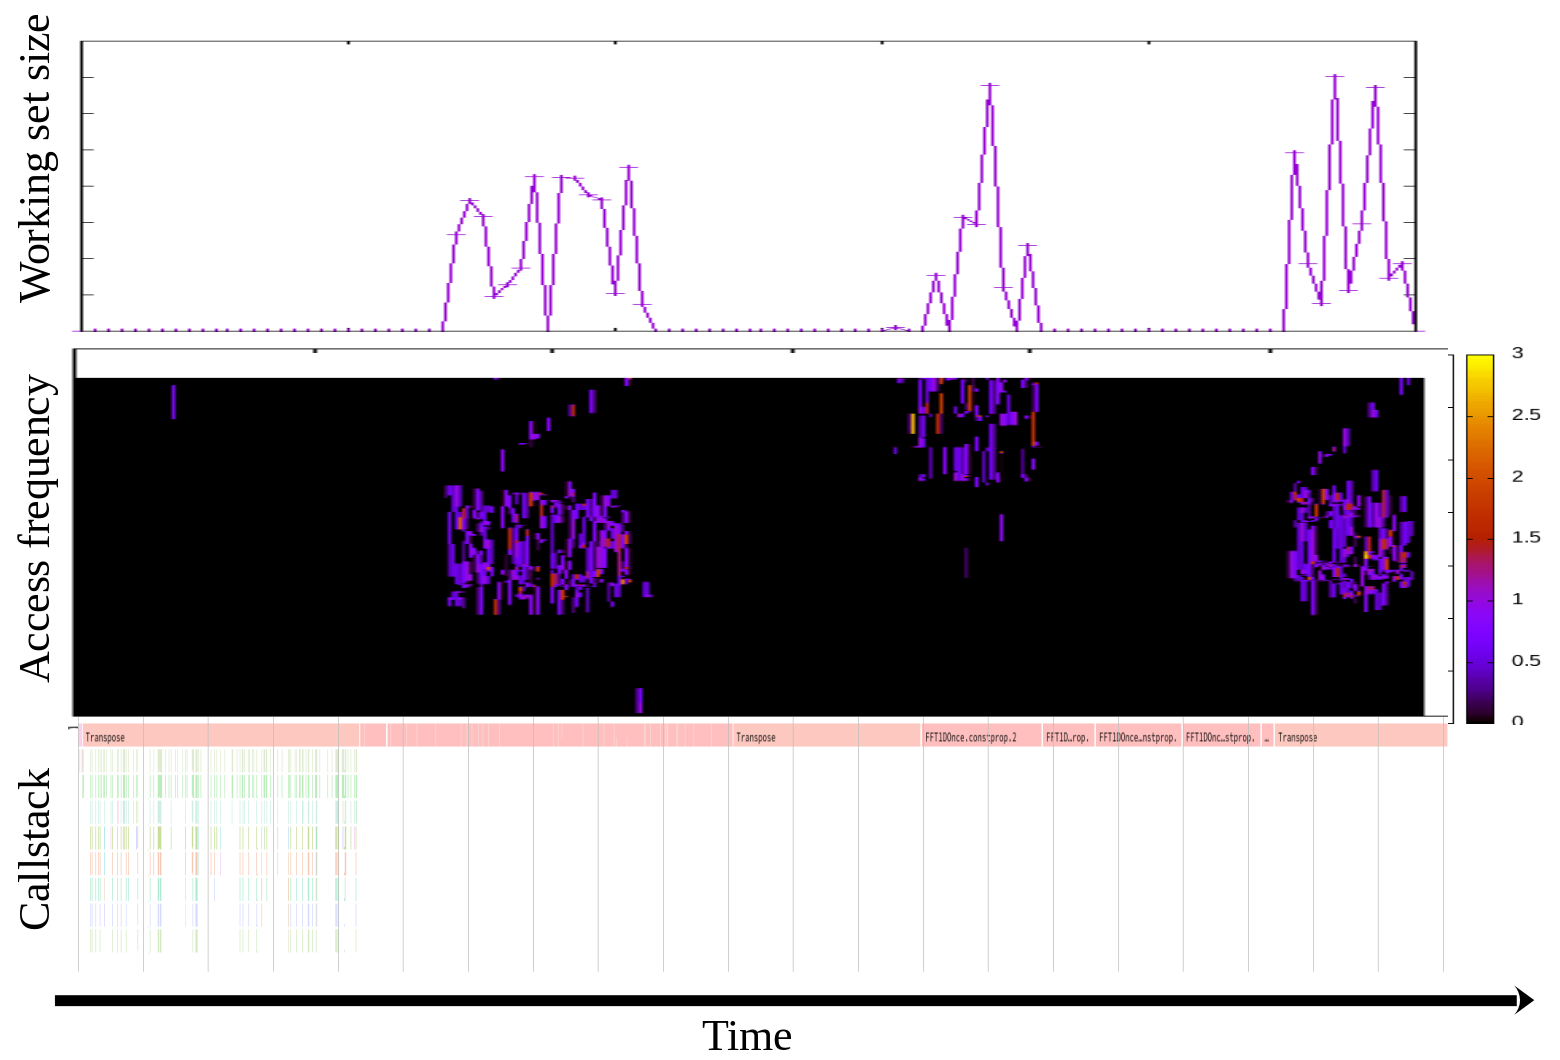
For example, below link shows that visualization for a realistic workload,
namely 'fft' in SPLASH-2X benchmark suite.  From that, you can know there are
three memory access bursting phases in the workload and
'FFT1DOnce.cons::prop.2()' looks responsible for the first and second hot
phase, while 'Transpose()' is responsible for the last one.  Now the programmer
can take a deep look in the functions and optimize the code (e.g., adding
madvise() or mlock() calls).

    https://damonitor.github.io/temporal/damon_callstack.png

We used the approach for 'mlock()'-based optimization of a range of other
realistic benchmark workloads.  The optimized versions achieved up to about
2.5x performance improvement under memory pressure[1].

Note: I made the uppermost two figures in above 'fft' visualization (working
set size and access frequency of each memory region by time) via the DAMON user
space tool[2], while the lowermost one (callstack by time) is made using perf
and speedscope[3].  We have no descent and totally automated tool for that yet
(will be implemented soon, maybe under perf as a perf-script[4]), but you could
reproduce that with below commands.

    $ # run the workload
    $ sudo damo record $(pidof <your_workload>) &
    $ sudo perf record -g $(pidof <your_workload>)
    $ # after your workload finished (you should also finish perf on your own)
    $ damo report wss --sortby time --plot wss.pdf
    $ damo report heats --heatmap freq.pdf
    $ sudo perf script | speedscope -
    $ # open wss.pdf and freq.pdf with our favorite pdf viewer

[1] https://linuxplumbersconf.org/event/4/contributions/548/attachments/311/590/damon_ksummit19.pdf
[2] https://lore.kernel.org/linux-mm/20201215115448.25633-8-sjpark@amazon.com/ (local)
[3] https://www.speedscope.app/
[4] https://lore.kernel.org/linux-mm/20210107120729.22328-1-sjpark@amazon.com/ (local)